Motivation
Adobe Research Labs developed an algorithm to classify the emotional content, i.e. the degree of emotions, contained within a tweet. I was tasked to create a compelling visualization that showcased the variety of emotions contained in the spectrum of incoming tweets.
Process
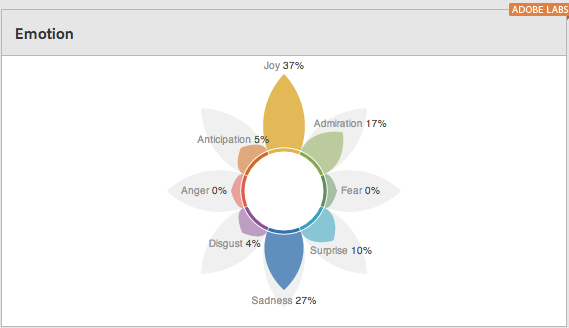
Traditional graphs and pie charts were evaluated and found to be insufficient to communicate the varying degree of emotions contained within the tweets. Dr. Robert Plutchik, created a visual representation of emotions, called the flower petal model of visualization. It was understood that this was the best model to showcase emotional content within the tweets. I had to explore various technologies and methods to create a compelling visual display of the identified emotions.
Challenges
In this project the two main challenges that were confronted were engineering and design perspective. Initially it was decided to showcase each individual tweet as a bubble, as shown in the accompanied video, which quickly became troublesome as the number of tweets for certain keywords were enormous. We solved this by data summarization in which we showcased aggregated emotions and the user could delve into further details of that emotion and identify individual tweets.
Value Addition
This prototype was showcased at Adobe’s Digital Marketing summit. The prototype idea was further developed by the engineering groups at Adobe to include it within Adobe’s Digital Marketing Platform.